Activity

Measure Engagement. Improve Focus.

Simple black outlined square with a small black diamond shape attached at the bottom right corner.

Get real-time visibility into how engaged your teams truly are through clicks, keypresses, and activity trends. Monitor where time is spent and make data-backed decisions that improve team performance.

Diagram showing activity level breakdown with 40 active users: 60% at 75-100%, 20% at 50-75%, and 20% below 50%, with a highlighted peak active interval from 2 PM to 3 PM at 65% activity.
Online time breakdown showing 8 hours total with 7 hours 30 minutes active time and 30 minutes idle time. Bar chart lists top 3 most active teams: Marketing 80.11%, Technology 77.44%, Design 55.22%, and top 3 least active teams: HR 10.11%, Back office 20.09%, Sales 30.02%.

Engagement at a Glance

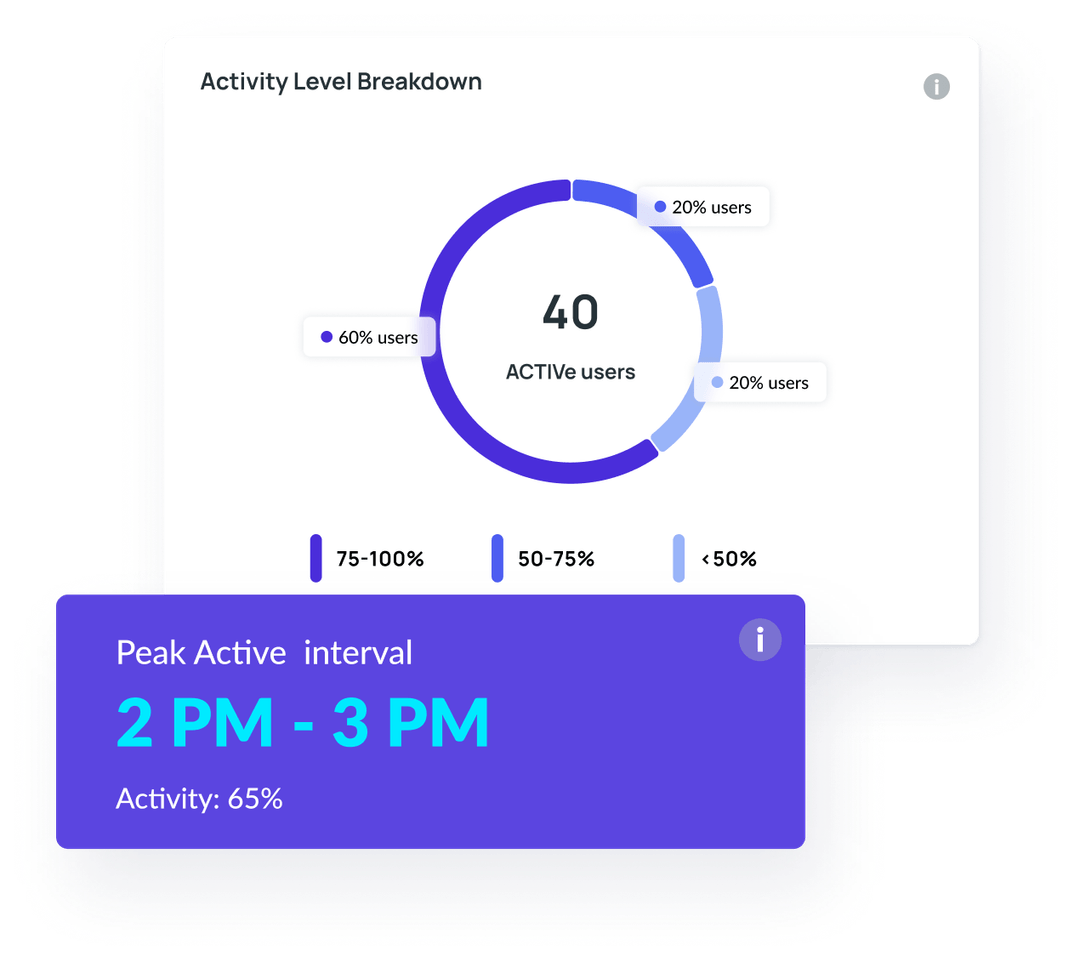
See top tools, websites, categories, and activity trends in one simplified dashboard.

The Overview tab offers a snapshot of real-time employee engagement across your organization. It highlights top-used applications, most visited URLs, and the categories employees interact with most—like communication, design, or project management. You’ll also see average active time, idle time, and key engagement metrics like keypresses and mouse activity. This tab is ideal for leaders who want a daily pulse check on how work is happening—without digging into complex reports.

Dashboard showing various downloadable reports including Daily Attendance, Monthly Attendance, Arrival report, Break Report, Productivity Report, Activity Report, Application Report, and Graphical Report, and a detailed Activity Report table with employee names, online time, active time, idle time, and activity percentage for selected dates.

Top and Bottom Performers

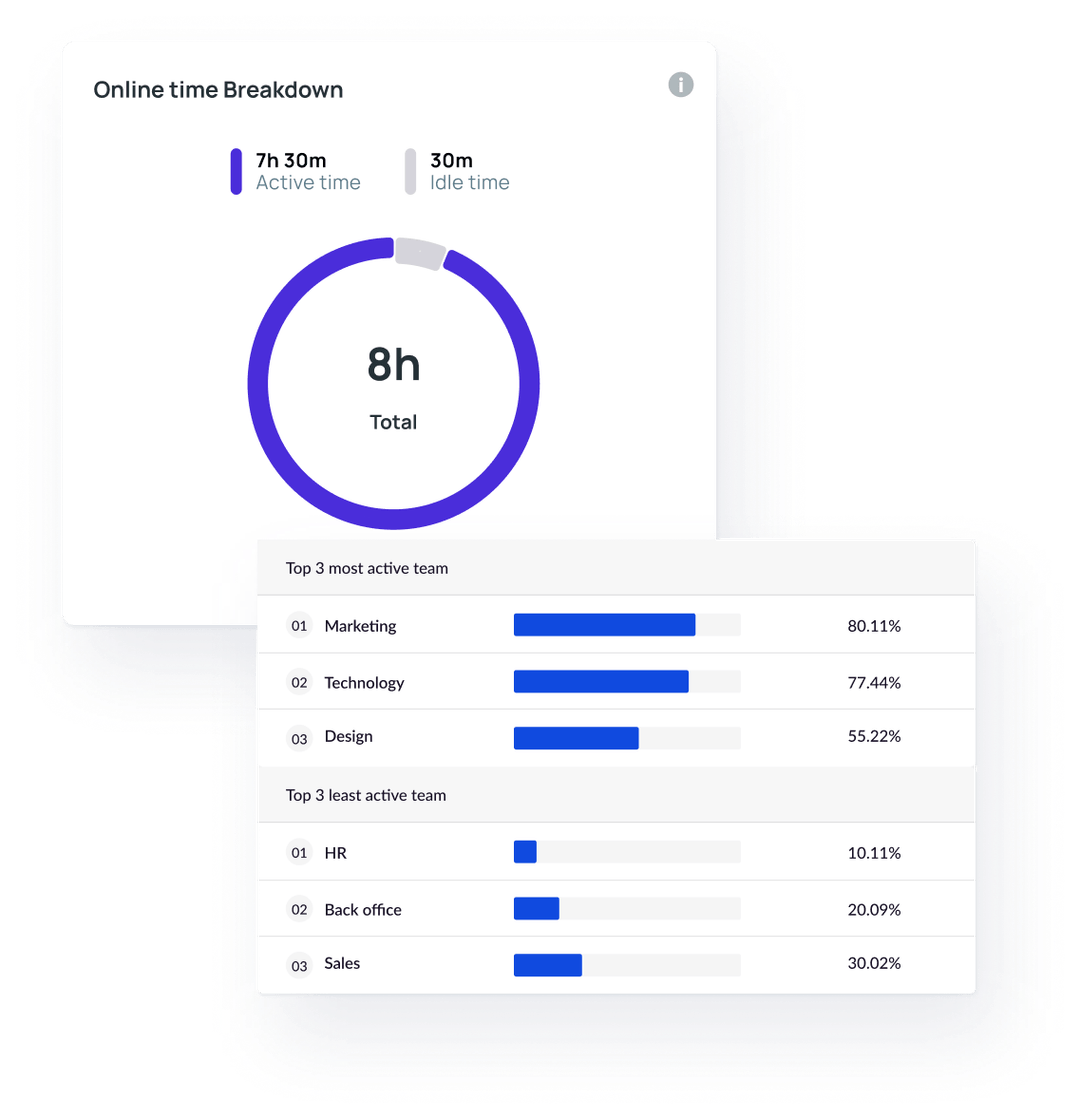
Instantly spot your most and least engaged teams based on activity data.

This tab reveals the top 3 and bottom 3 teams based on activity percentage. Whether you're managing 5 teams or 50, you’ll know exactly who’s fully engaged and who may be struggling or underutilized. Use this insight to investigate coaching needs, resource misalignment, or burnout risk. The goal is to quickly surface gaps without manually comparing data across departments—so action can follow insight faster.

Top 3 most active teams: Marketing 80.11%, Technology 77.44%, Design 55.22%. Top 3 least active teams: HR 10.11%, Back office, and Sales. Bar chart showing teamwise active and idle time from 27 Sep to 04 Oct, with active time in blue and idle time in gray.

Time-Based Engagement Trends

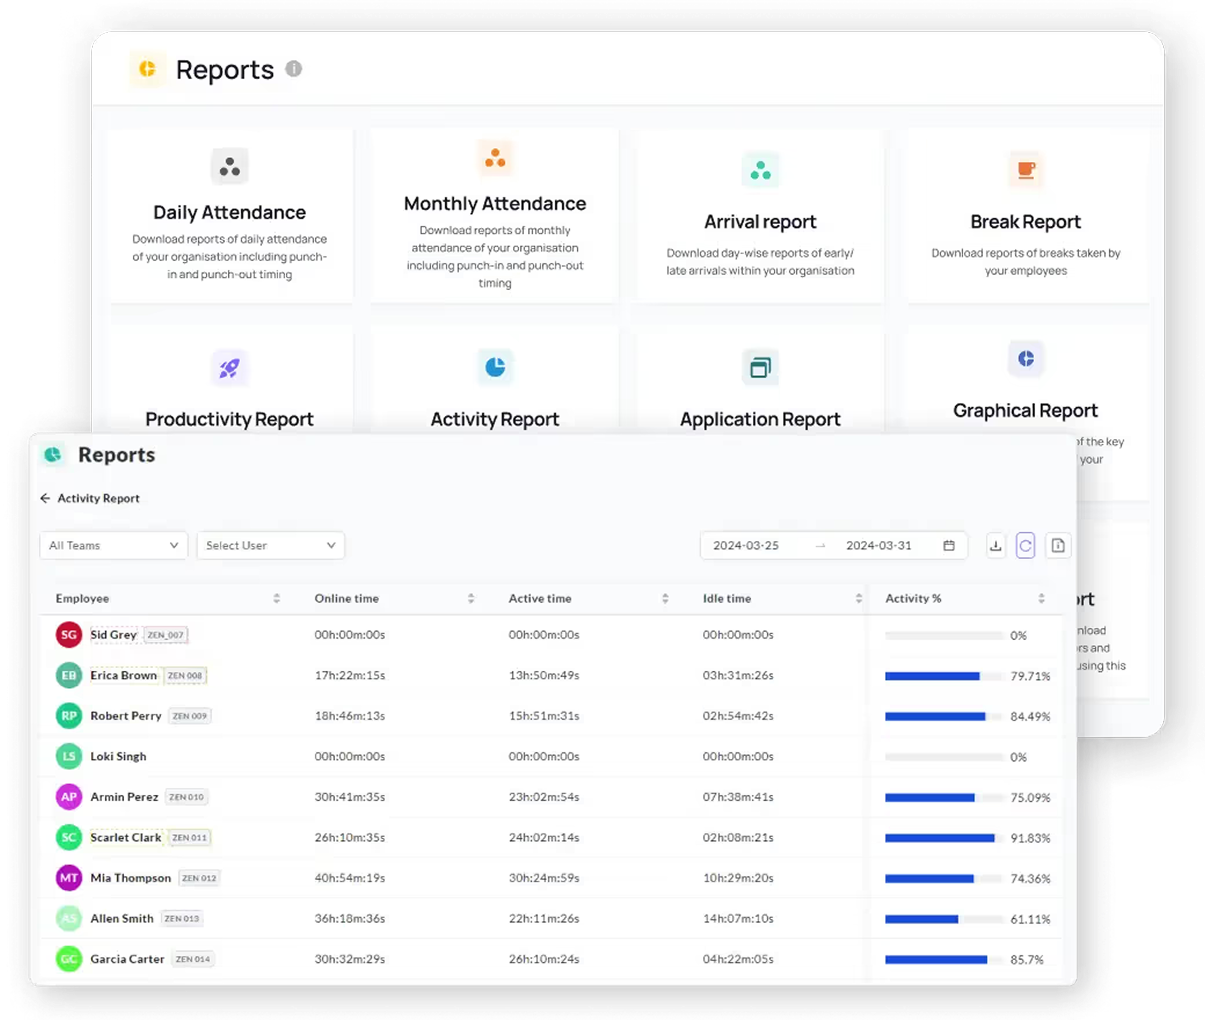
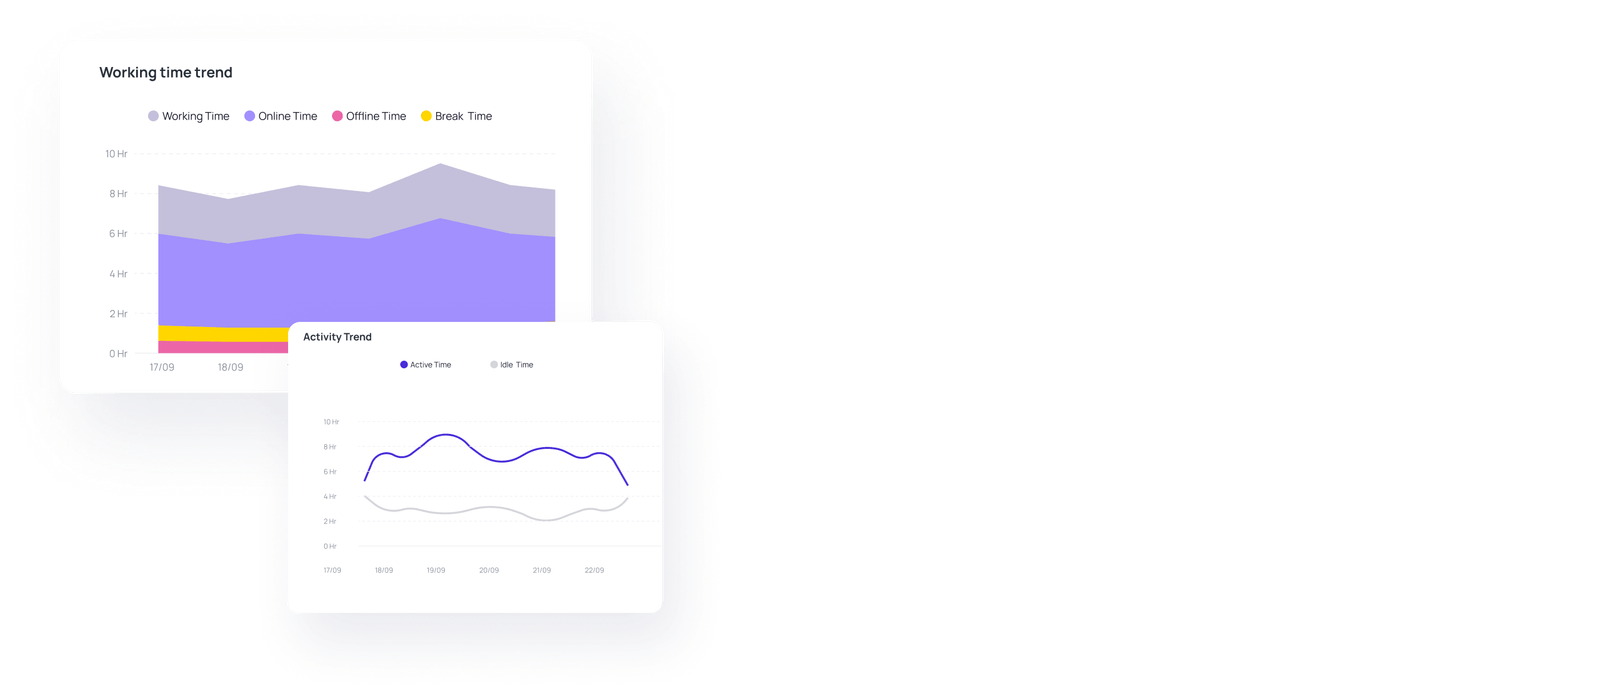
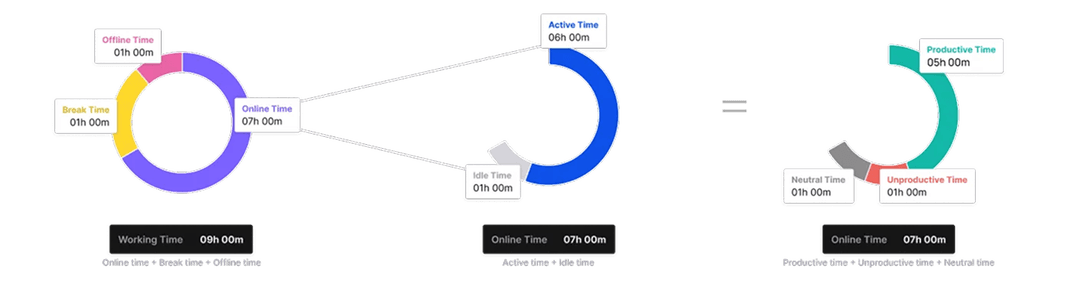
Track how activity evolves over time—by team, employee, and work pattern.

This section shows time-based graphs and tables that map working hours vs active hours. You can view weekly or monthly trends and dive into employee-level analytics to spot patterns. For example, is a team’s engagement dropping on Fridays? Are certain employees consistently active for fewer hours than expected? This feature helps HR and managers find performance fluctuations and act before they affect outcomes.

Two charts showing work trends: a stacked area chart with Working, Online, Offline, and Break Time from 17/09 to 22/09, and a line chart with Active and Idle Time over the same period.

Ask, Know, Act Instantly

Ask anything. ZenAI gives instant answers from your activity data—no digging required.

ZenAI is your personal AI analyst. Just type in questions like “Which department had the lowest activity last week?” or “Show me users with over 80% activity this month”—and get precise answers instantly. It eliminates the need to manually sift through filters or reports. ZenAI understands natural language and responds with real-time insights, making data accessible to everyone, even without analytics experience.

How it works

We're more than an analytic
tool. Explore our features, and
satisfy your customers

Magic wand icon with sparkles inside a light blue circle.

Easy customization

No matter what kind of home you have to share, you can increase your earnings.

Speedometer icon inside a light blue circle.

Secure and fast

No matter what kind of home you have to share, you can increase your earnings.

Shield icon with a checkmark inside, symbolizing security or protection, on a light blue circular background.

Powerful dashboard

No matter what kind of home you have to share, you can increase your earnings.

Three linked ring charts showing time distribution: left donut chart with Offline Time 1h, Break Time 1h, Online Time 7h; middle ring chart splits Online Time into Active Time 6h and Idle Time 1h; right ring chart splits Active Time into Productive Time 5h, Unproductive Time 1h, and Neutral Time 1h.

For
Whom?

Perfect for senior managers, HR leaders, and team heads who want proactive AI-driven insights instead of manual data crunching.

Network illustration showing three connected smiling men inside circles of different sizes on a light background.
Line chart showing attrition trend by region with departments Hilliard, Detroit, and Powell from January to December, highlighting Hyderabad as an underperforming region with productivity at 42%, attendance at 62%, and cost efficiency at 54%.

Feature Benefits Visual Section

Green check mark icon indicating confirmation or success.

Actionable AI

Delivers clear, contextual recommendations—not generic suggestions.

Green check mark icon indicating confirmation or success.

Continuous Monitoring

Scans all teams daily for immediate detection of critical issues.

Green check mark icon indicating confirmation or success.

Personalized Actions

Guidance tailored to each team’s specific trends and risk factors.

Green check mark icon indicating confirmation or success.

Actionable AI

Helps reduce churn with early warnings on disengagement.

Built for Enterprise IT Secure, Compliant, and Scalable

Ensures privacy and security with encrypted data, secure connections, and multi-standard compliance

AICPA SOC2 Type II certification badge with blue circular gradient background.

SOC2 TYPE II

Demonstrating our commitment to security, availability, processing integrity, confidentiality, and privacy.

Blue circular badge with white text reading GDPR Approved and a green check mark below five gold stars.

GDPR

Ensuring compliance with European Union data protection and privacy regulations.

Red and gold ISO 27001 certified badge with stars and laurel wreath design.

ISO

Certified adherence to international standards for information security management.

HIPAA logo featuring the caduceus medical symbol with two snakes entwined around a winged staff on a blue circular background.

HIPAA

Demonstrating our commitment to health data privacy, security, and HIPAA compliance.

Frequently Asked Questions

Who is vsg-365.ai for? What kind of companies benefit most?
My team is already productive. Why would I need vsg-365.ai?
How does vsg-365.ai ensure the security and privacy of our company and employee data?
What about employee privacy?
Where is our data stored?
What are the system requirements for vsg-365.ai?