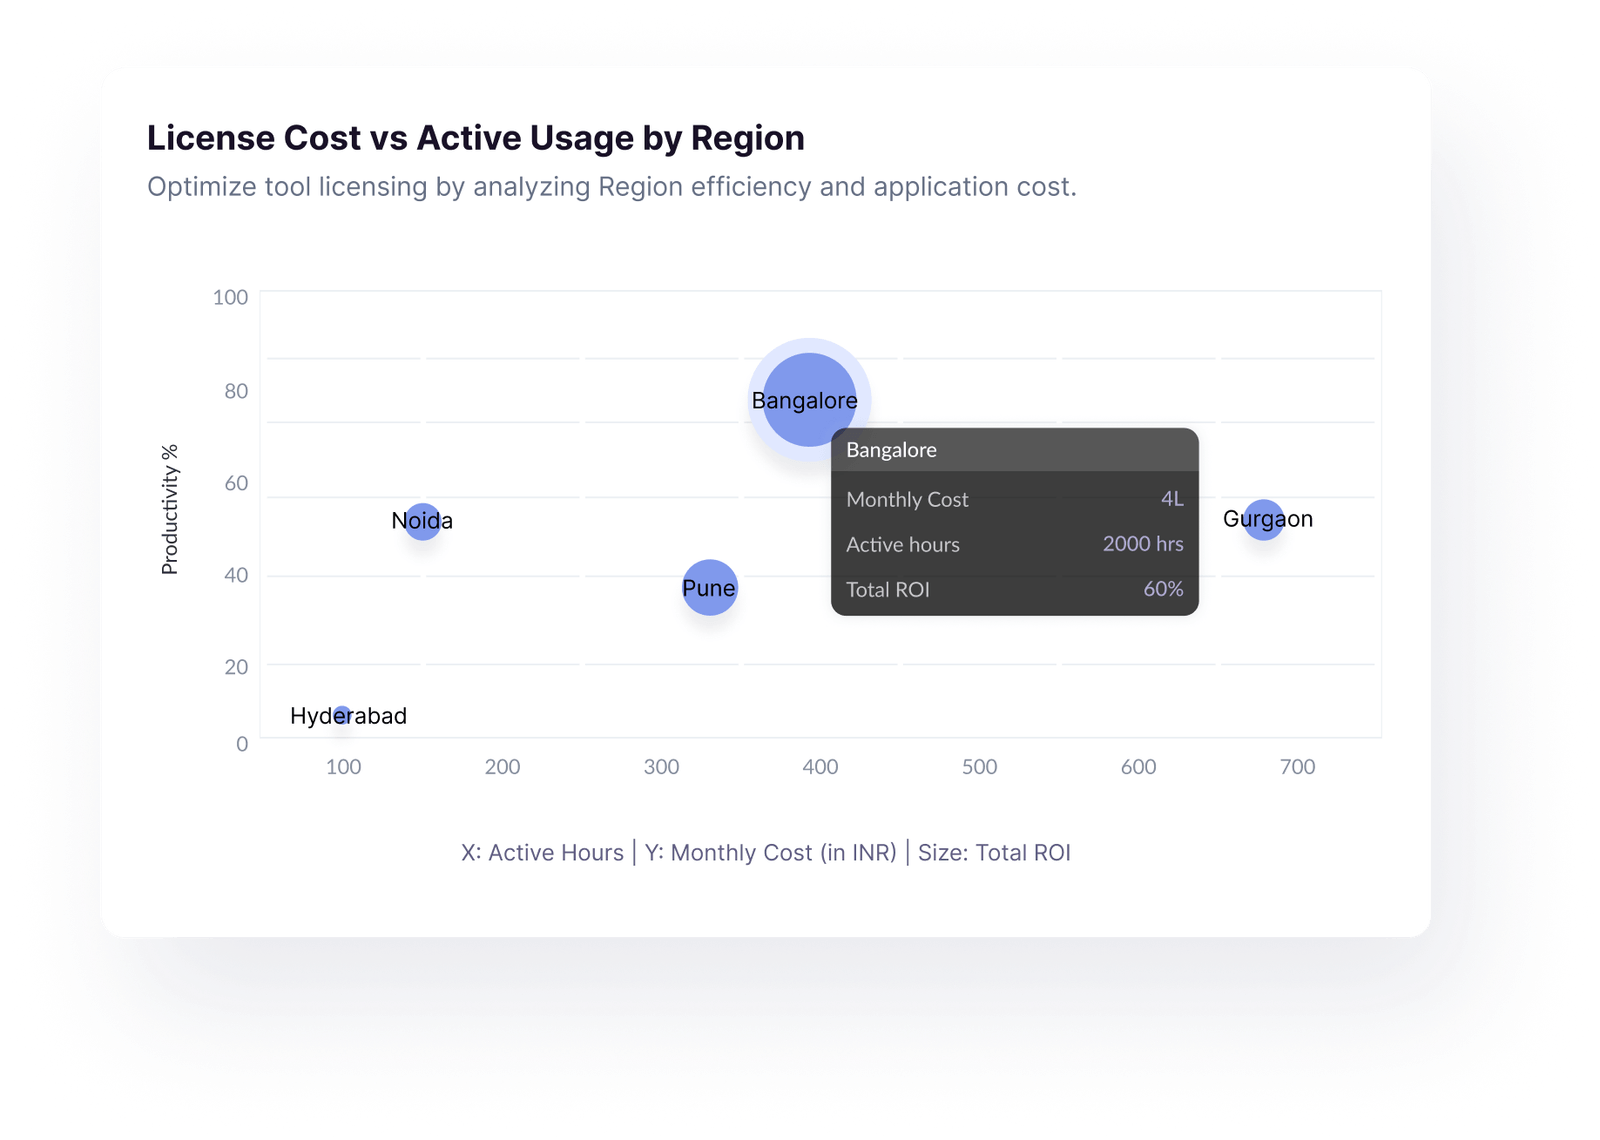
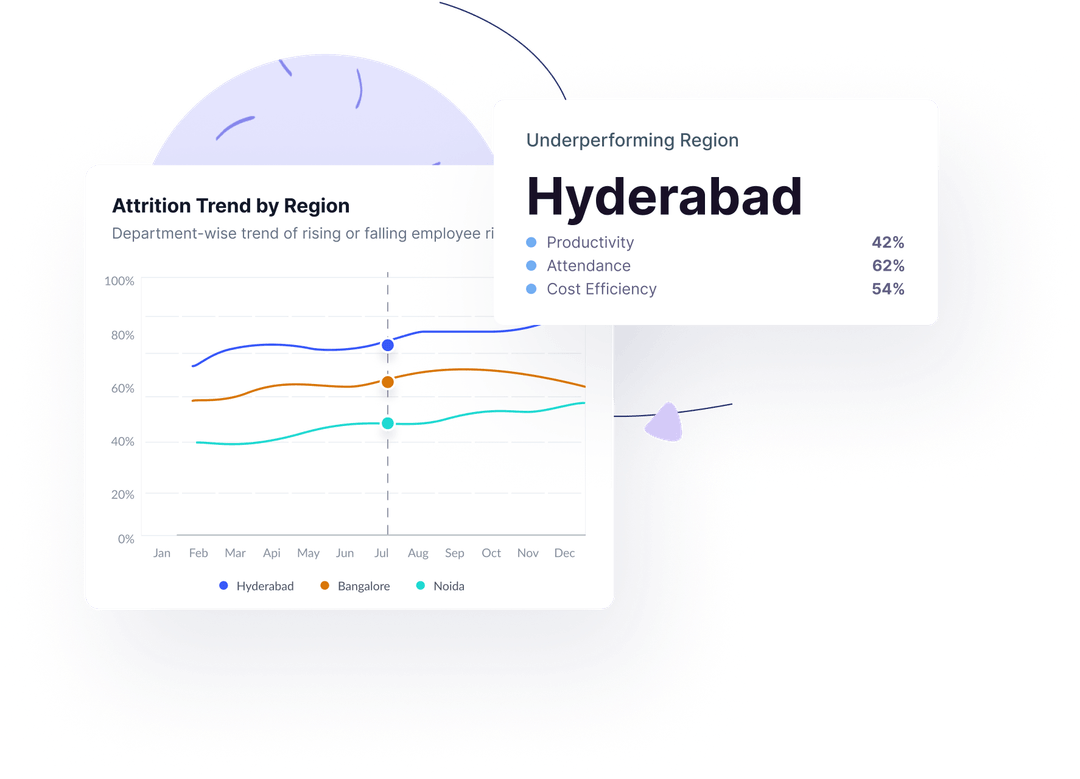
Location Performance

Visual Clarity Into Workflows—When You Need It

Simple black outlined square with a small black diamond shape attached at the bottom right corner.

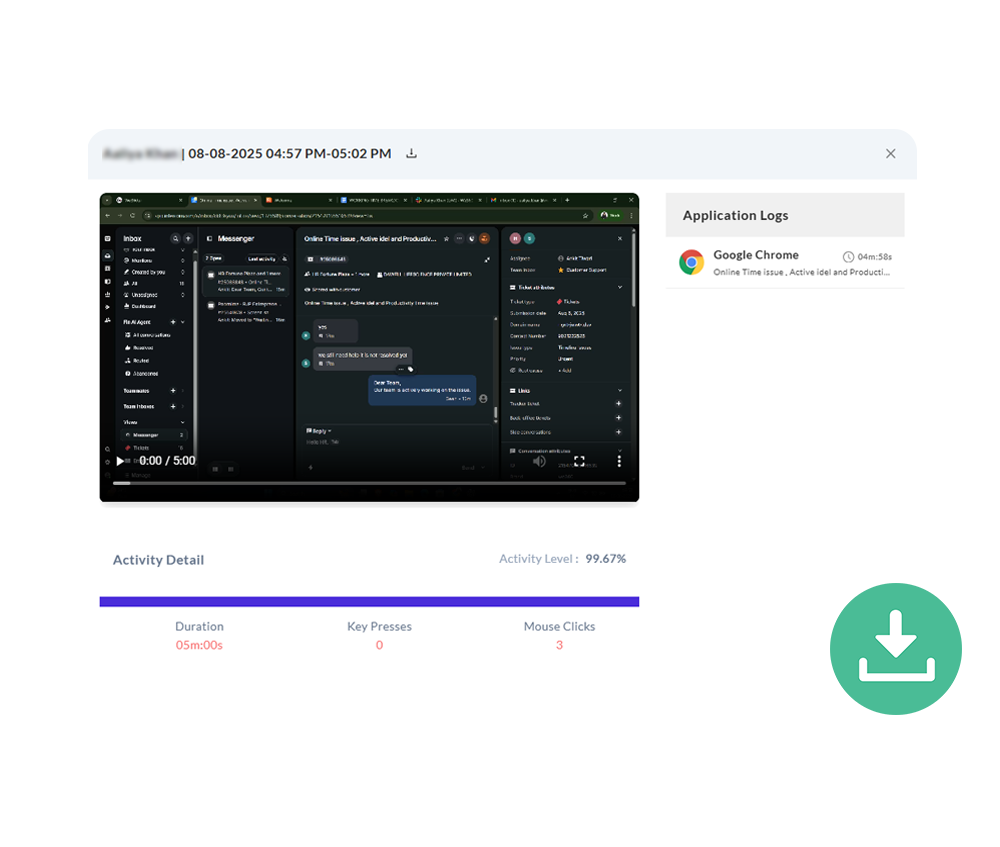
Screen Recording offers a responsible, review-ready way to understand how work gets done—capturing context without overstepping boundaries. Support coaching, audits, and process improvements with visual insights across teams and timelines.

Bar chart showing region-wise capacity distribution with categories Healthy, Overburdened, and Underutilised for cities Mumbai, Pune, Bangalore, Hyderabad, and Gurgaon; with a purple info box highlighting Bangalore as the best performing region in productivity (72%), attendance (92%), and cost efficiency (84%).
Screenshot of a video player paused at 0:00/4:59 showing a chat inbox interface, with activity details indicating 5 minutes duration, 0 key presses, 7 mouse clicks, and an activity level of 97.33%, plus a pop-up showing Google Chrome application logs.

Understand workflows visually—team by team

See the bigger picture, frame by frame

Get a high-level summary of recent recordings categorized by team, duration, and purpose. See where reviews are happening most—whether for training, audits, or quality checks. A centralized view designed to support decision-making, not micromanagement.

Screenshot of activity detail panel showing 96% activity level with duration 5 minutes, 42 key presses, and 91 mouse clicks, alongside a video player and a sidebar listing recent applications including Google Chrome and Windows Explorer with respective usage times.

Watch work sessions unfold as they happen

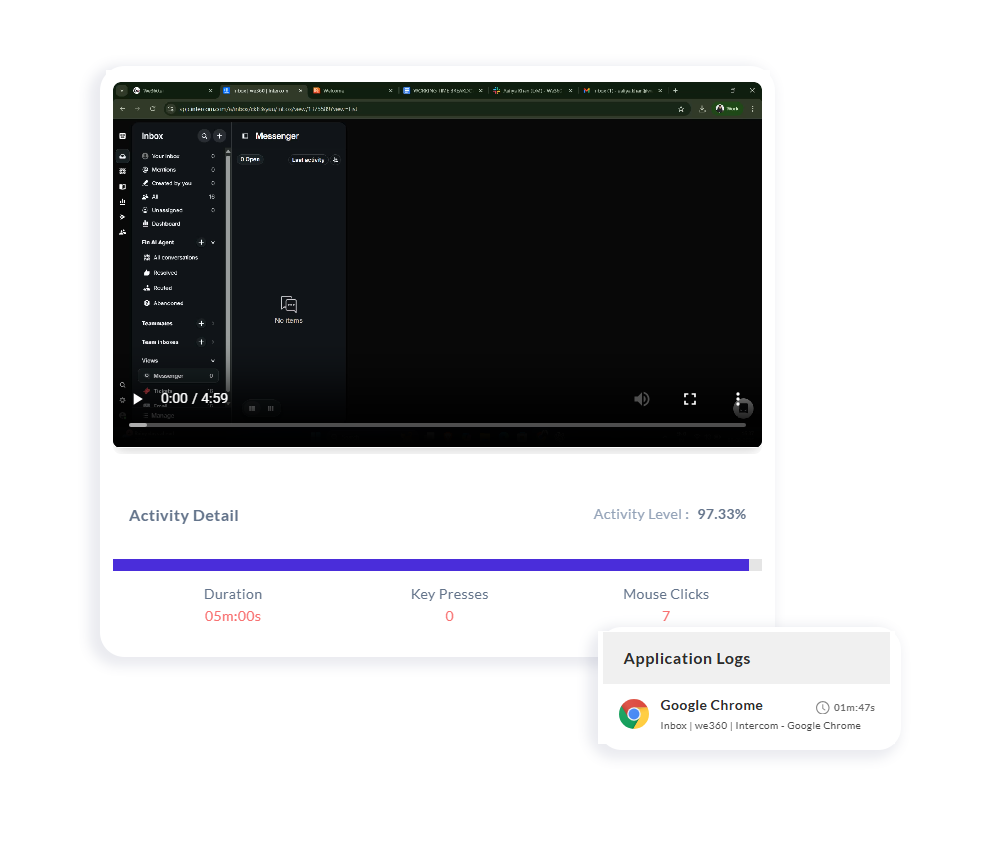
Real-time awareness—without interference

Gain live visual insight into current workflows when needed. Ideal for high-priority tasks, collaborative reviews, or real-time process support. Visibility that helps without interrupting—designed for trust and transparency.

Screenshot of a productivity monitoring dashboard showing a chat conversation in dark mode, activity details with duration of 5 minutes, zero key presses, three mouse clicks, and an activity level of 99.67%.

Download and revisit recordings with ease

Save, share, and review—on your terms

Export specific screen sessions to share with team leads, trainers, or auditors. Use it to clarify misunderstandings, highlight excellence, or document workflows. Flexible download formats ensure recordings remain useful without bloating storage.

Bubble chart comparing license cost and active usage by region, showing Bangalore, Gurgaon, Pune, Noida, and Hyderabad with their productivity percentages, active hours, monthly cost, and ROI size.

Turn screen data into actionable patterns

Beyond playback—see what’s worth seeing

Analyze trends across recordings—like session durations, review frequency, and team-level playback rates. Identify patterns in how work is performed or where bottlenecks occur. Supports data-led coaching, process improvements, and performance insights.

How it works

We're more than an analytic
tool. Explore our features, and
satisfy your customers

Magic wand icon with sparkles inside a light blue circle.

Easy customization

No matter what kind of home you have to share, you can increase your earnings.

Speedometer icon inside a light blue circle.

Secure and fast

No matter what kind of home you have to share, you can increase your earnings.

Shield icon with a checkmark inside, symbolizing security or protection, on a light blue circular background.

Powerful dashboard

No matter what kind of home you have to share, you can increase your earnings.

Three linked ring charts showing time distribution: left donut chart with Offline Time 1h, Break Time 1h, Online Time 7h; middle ring chart splits Online Time into Active Time 6h and Idle Time 1h; right ring chart splits Active Time into Productive Time 5h, Unproductive Time 1h, and Neutral Time 1h.

For
Whom?

Perfect for senior managers, HR leaders, and team heads who want proactive AI-driven insights instead of manual data crunching.

Network illustration showing three connected smiling men inside circles of different sizes on a light background.
Line chart showing attrition trends by region with Hyderabad, Bangalore, and Noida; pop-up box highlights Hyderabad as an underperforming region with productivity at 42%, attendance at 62%, and cost efficiency at 54%.

Feature Benefits Visual Section

Green check mark icon indicating confirmation or success.

Actionable AI

Delivers clear, contextual recommendations—not generic suggestions.

Green check mark icon indicating confirmation or success.

Continuous Monitoring

Scans all teams daily for immediate detection of critical issues.

Green check mark icon indicating confirmation or success.

Personalized Actions

Guidance tailored to each team’s specific trends and risk factors.

Green check mark icon indicating confirmation or success.

Actionable AI

Helps reduce churn with early warnings on disengagement.

Built for Enterprise IT Secure, Compliant, and Scalable

Ensures privacy and security with encrypted data, secure connections, and multi-standard compliance

AICPA SOC2 Type II certification badge with blue circular gradient background.

SOC2 TYPE II

Demonstrating our commitment to security, availability, processing integrity, confidentiality, and privacy.

Blue circular badge with white text reading GDPR Approved and a green check mark below five gold stars.

GDPR

Ensuring compliance with European Union data protection and privacy regulations.

Red and gold ISO 27001 certified badge with stars and laurel wreath design.

ISO

Certified adherence to international standards for information security management.

HIPAA logo featuring the caduceus medical symbol with two snakes entwined around a winged staff on a blue circular background.

HIPAA

Demonstrating our commitment to health data privacy, security, and HIPAA compliance.

Frequently Asked Questions

Who is vsg-365.ai for? What kind of companies benefit most?
My team is already productive. Why would I need vsg-365.ai?
How does vsg-365.ai ensure the security and privacy of our company and employee data?
What about employee privacy?
Where is our data stored?
What are the system requirements for vsg-365.ai?