

⚡ Join us for the Silver Jubilee episode of our LinkedIn talk show. ⚡
Book a Demo

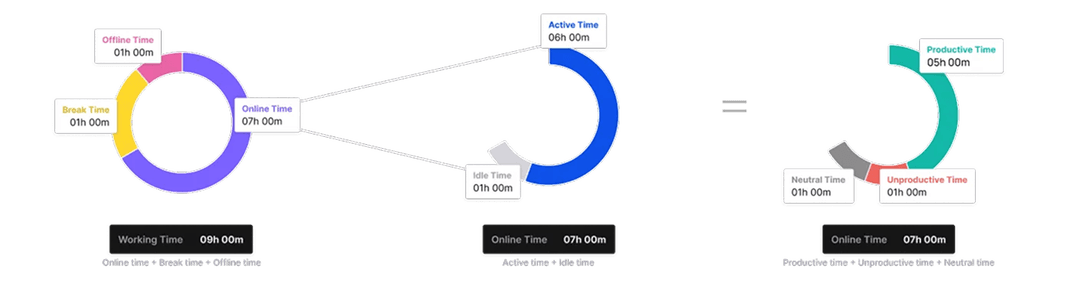
Attendance Insights

Stay ahead of typical “punch-in” and “punch-out” times with smart, real-time attendance insights that drive productivity and accountability among teams. VSG-365.ai’s smart attendance tracking helps to keep you effortlessly informed. Zero guesswork. Only accurate attendance metrics.
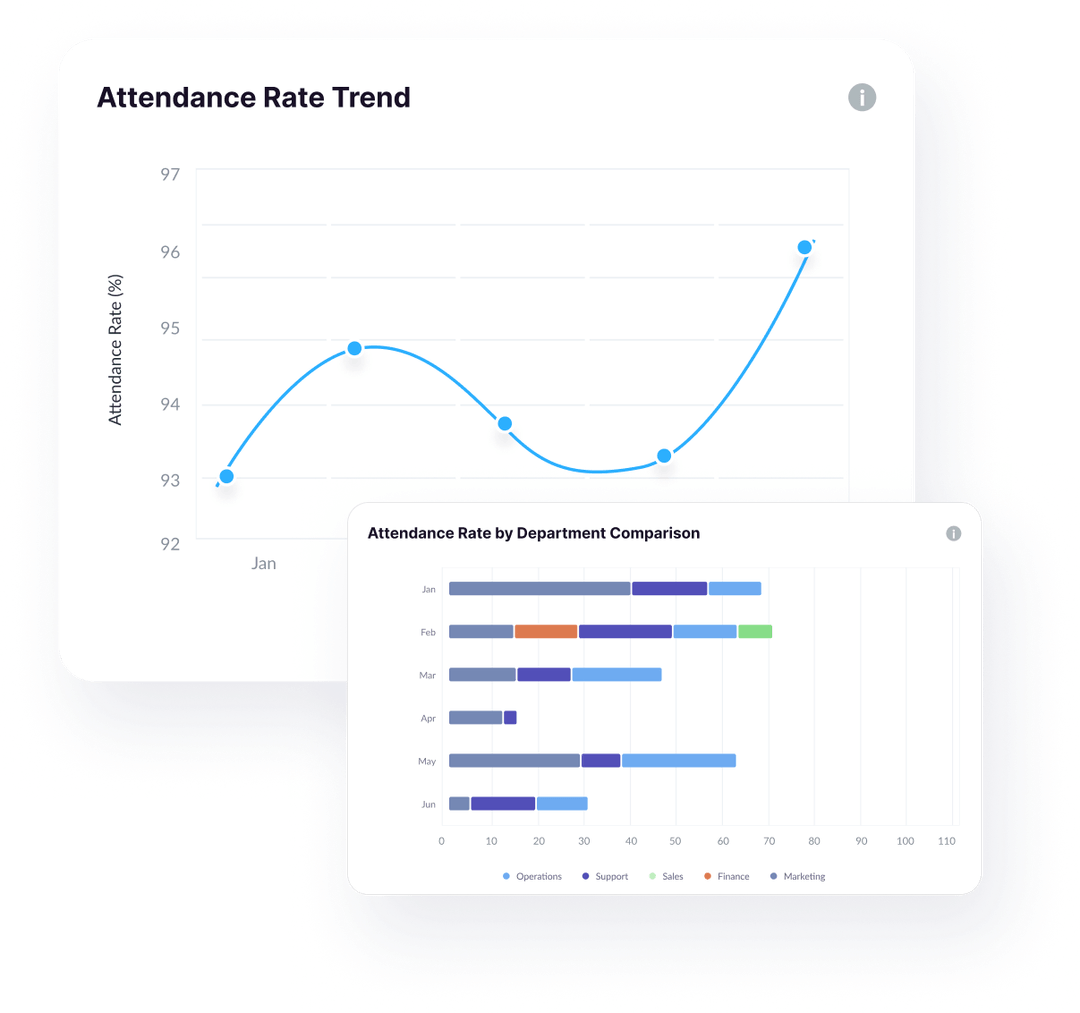
Clear Numbers On Present & Absent Employees
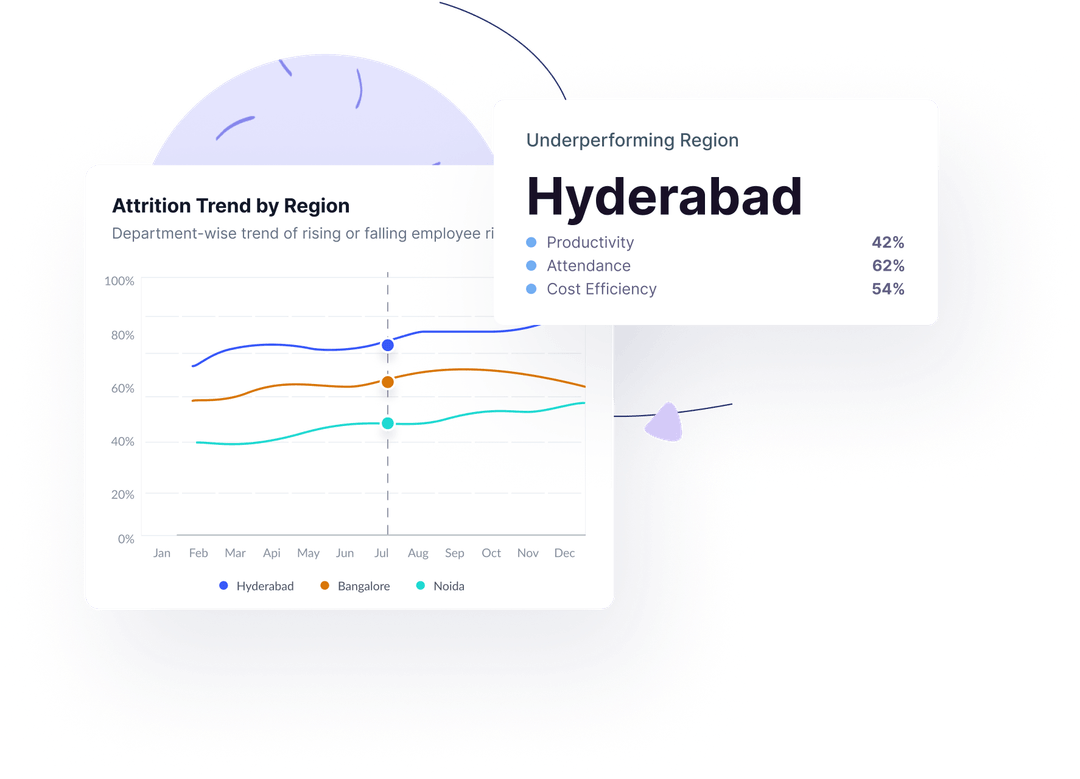
Why assume when you have clear data in your hands? With the crystal-clear view of your organisation’s attendance, including the real-time trends and department-wise comparisons. Instantly spot spikes in absenteeism and track improvements in attendance rates over time. Whether it’s monthly patterns or team-level breakdowns, this feature helps you turn raw numbers into actionable insights. Make smarter staffing, policy, and performance decisions with data that speaks.
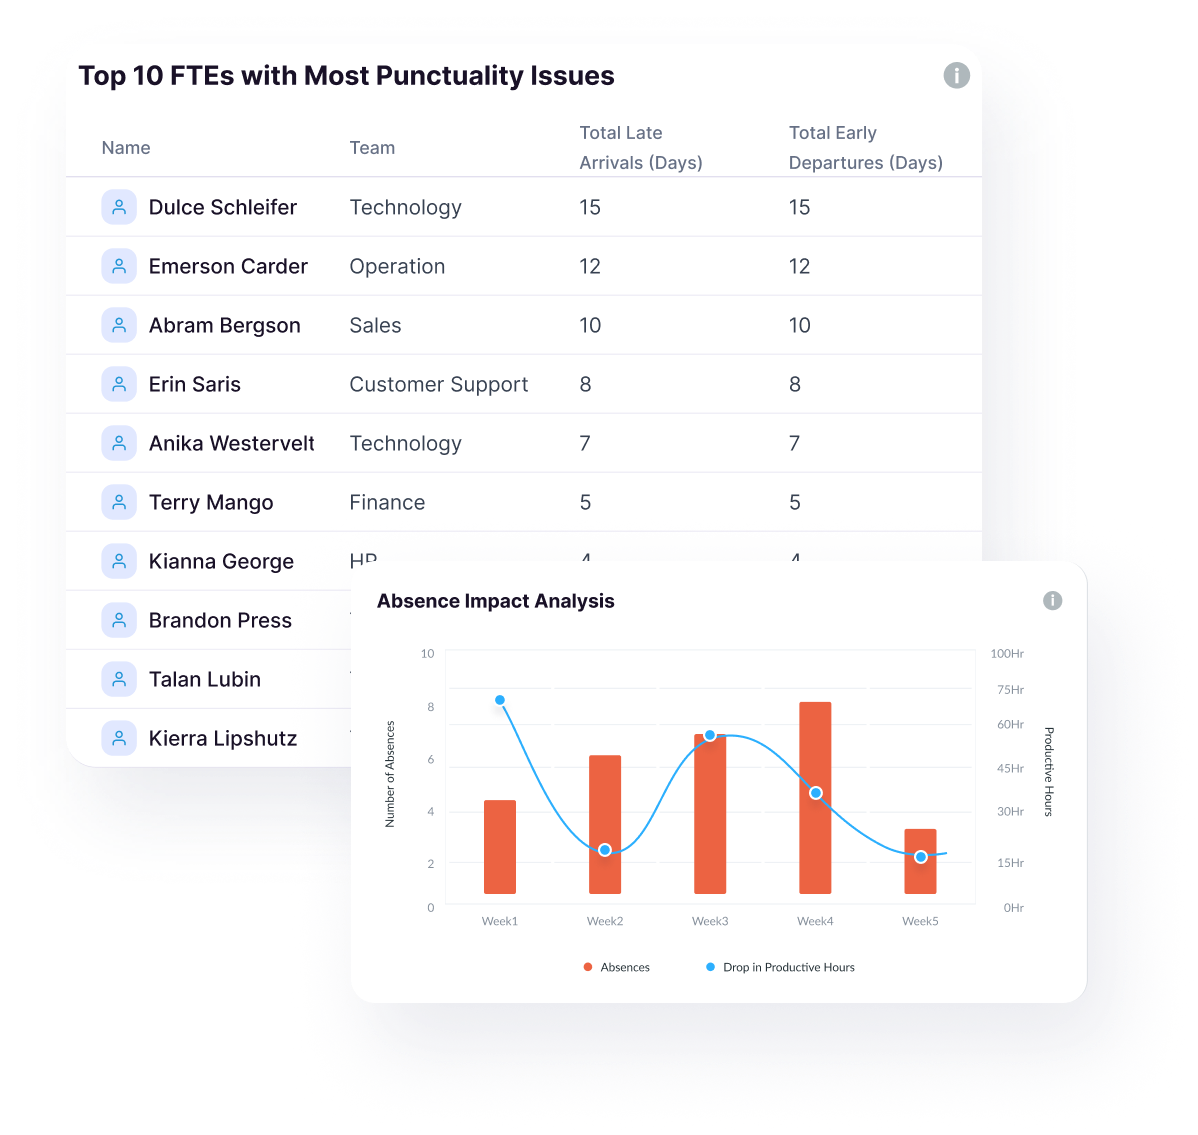
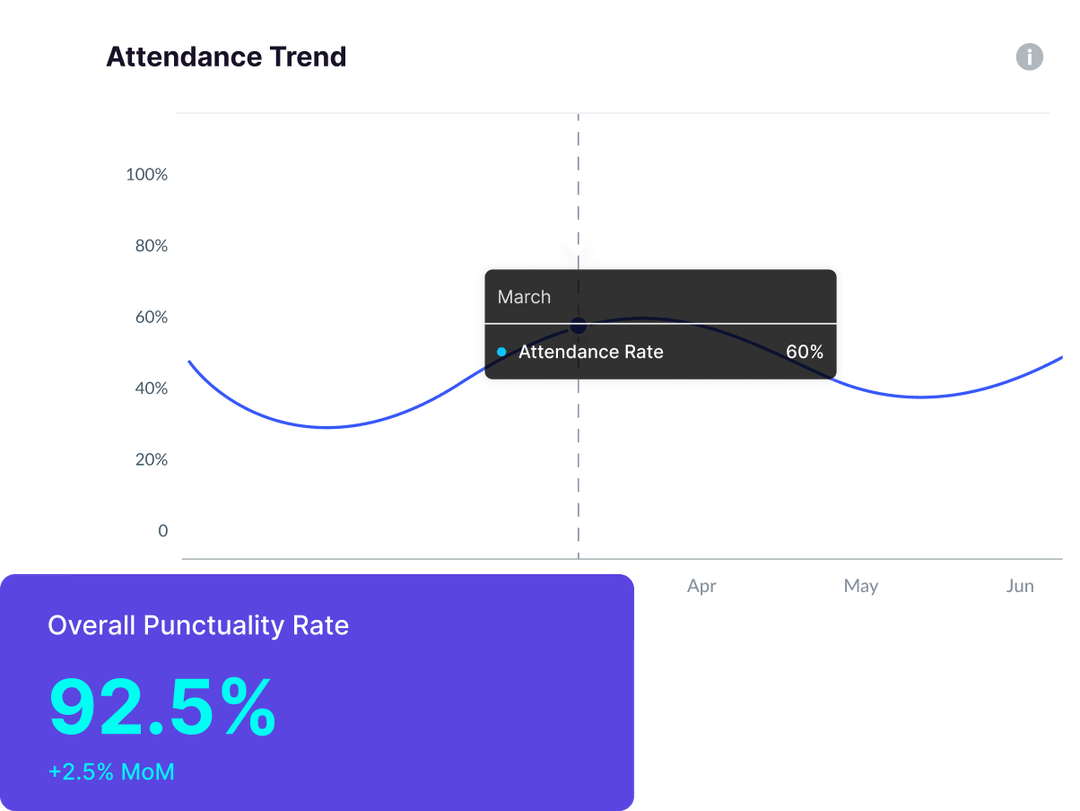
Accurate Punctuality Insights Without Punch-In and Out Method
Track late arrivals and early departures with precision, per employee, per day. Identify punctuality patterns, flag habitual delays, and foster a culture of accountability. This feature transforms time data into performance intelligence, helping managers take timely action before productivity takes a hit. Stay ahead of schedule, always.

Understand how, when, and why leaves are taken across your organization. From planned vacations to sudden absences, get a clear breakdown by type, frequency, department, and individual. Spot leave patterns, prevent burnout, and balance workloads better. With data-driven visibility, leave management becomes smarter, not stricter.
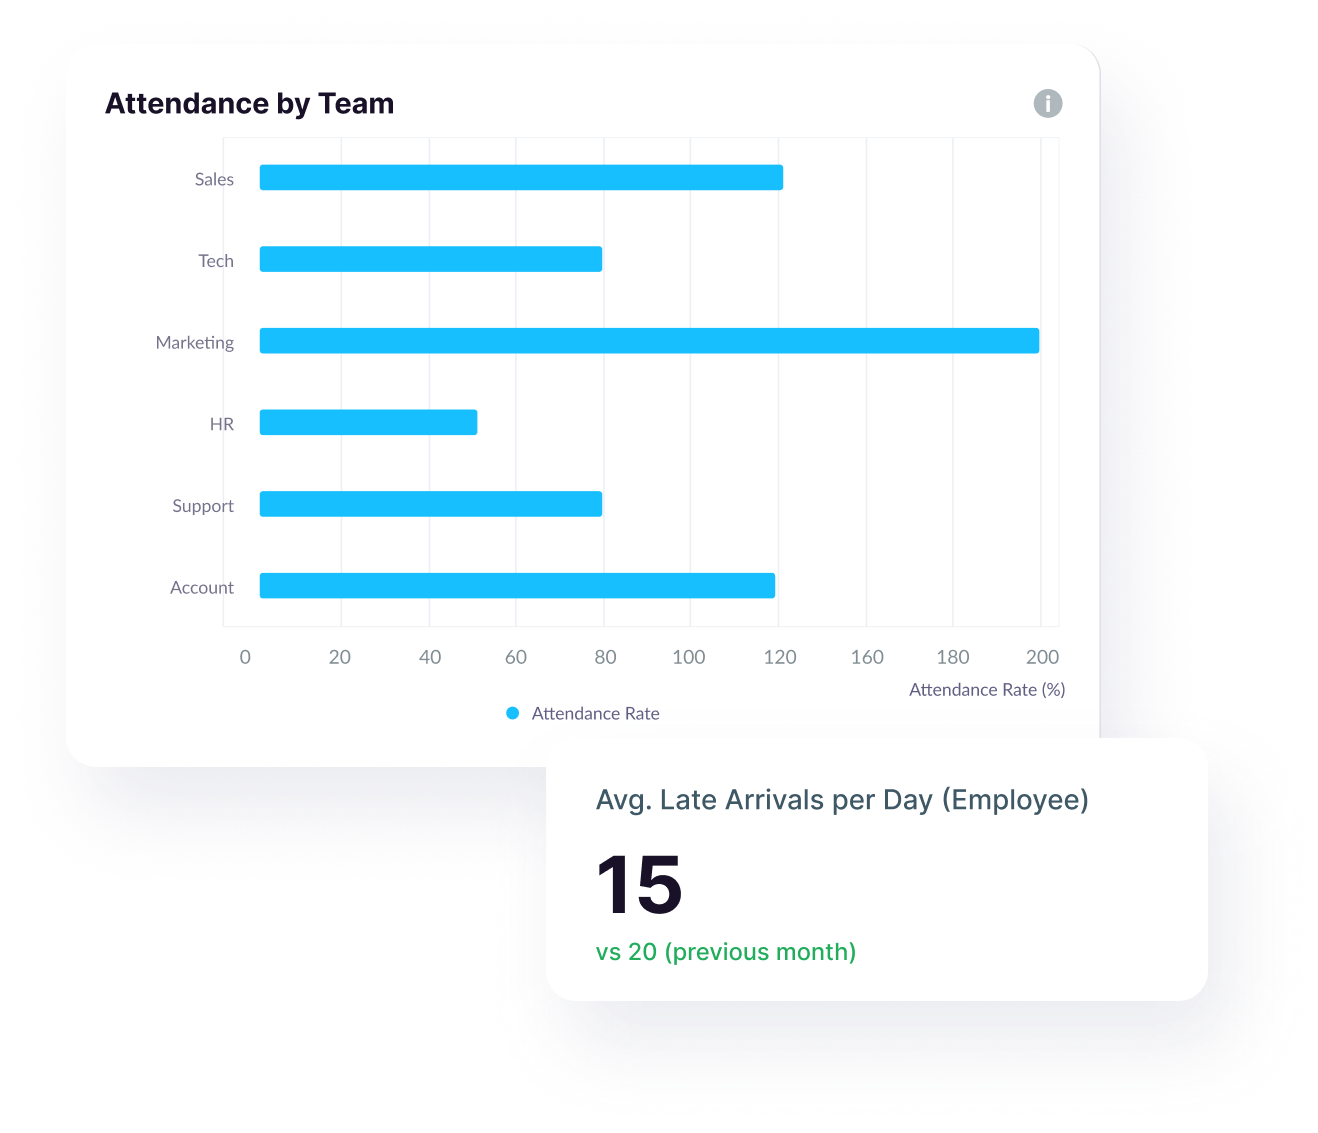
Track Teams’ Presence Like Never Before
Get a real-time, side-by-side view of attendance, punctuality, and leave patterns across every team. Instantly identify which departments are thriving and which need attention, without sifting through spreadsheets. This feature empowers managers to spot trends, improve team discipline, and make data-backed decisions that drive accountability and performance.

No matter what kind of home you have to share, you can increase your earnings.

No matter what kind of home you have to share, you can increase your earnings.

No matter what kind of home you have to share, you can increase your earnings.
Perfect for senior managers, HR leaders, and team heads who want proactive AI-driven insights instead of manual data crunching.


Delivers clear, contextual recommendations—not generic suggestions.
Scans all teams daily for immediate detection of critical issues.
Guidance tailored to each team’s specific trends and risk factors.
Helps reduce churn with early warnings on disengagement.
Ensures privacy and security with encrypted data, secure connections, and multi-standard compliance

Demonstrating our commitment to security, availability, processing integrity, confidentiality, and privacy.

Ensuring compliance with European Union data protection and privacy regulations.

Certified adherence to international standards for information security management.

Demonstrating our commitment to health data privacy, security, and HIPAA compliance.