
⚡ Join us for the Silver Jubilee episode of our LinkedIn talk show. ⚡
Book a Demo

Cost Intelligence

Track, optimize, and reduce your workforce spending with real-time cost insights.
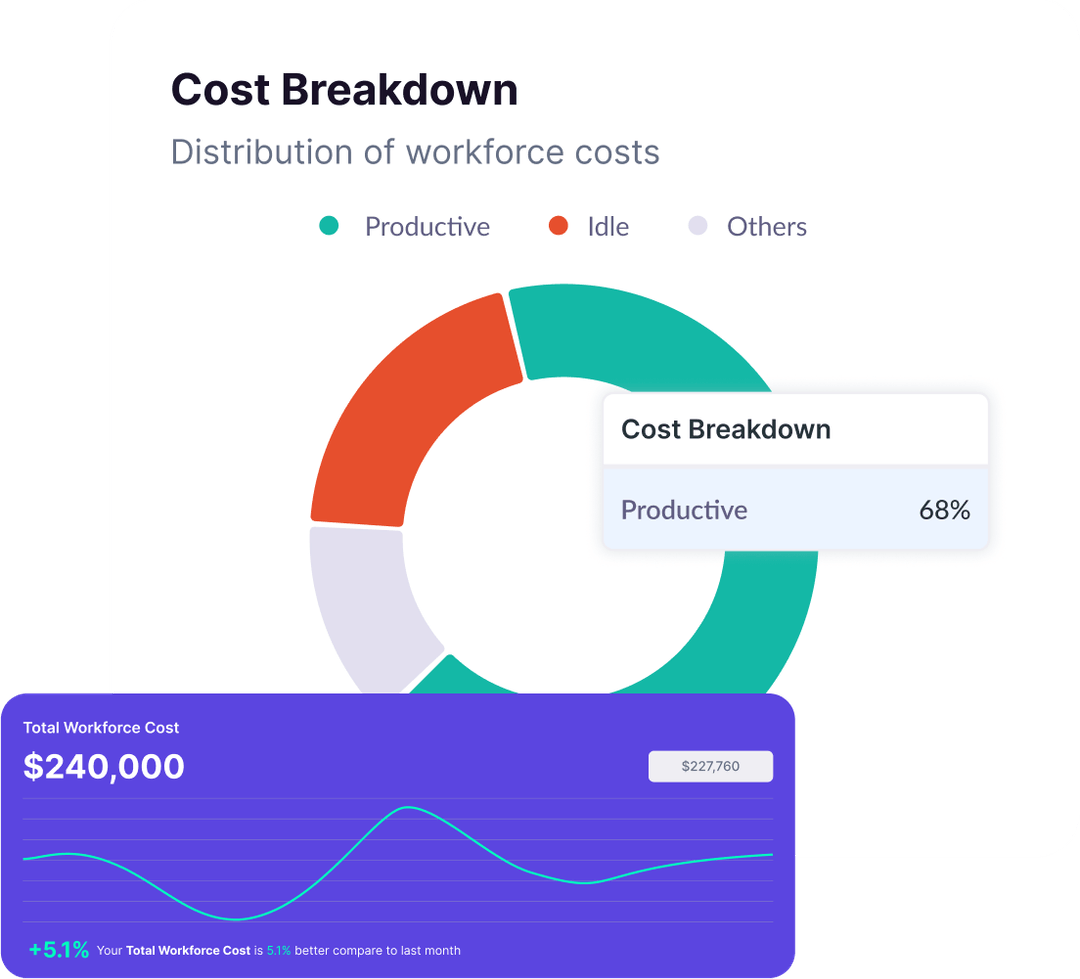

Understand where your workforce costs are going across departments, roles, and activities.
The Cost Breakdown tab gives a complete picture of how your organization is spending on its people. It shows total workforce cost, cost per employee, and cost per productive hour—updated in real time. You’ll see which departments are cost-heavy, where productivity is aligned with cost, and where inefficiencies exist. Visual breakdowns between productive, idle, and other costs help leaders see how effectively human capital is being used. This section helps CFOs and HR teams drive more informed budgeting and team planning.
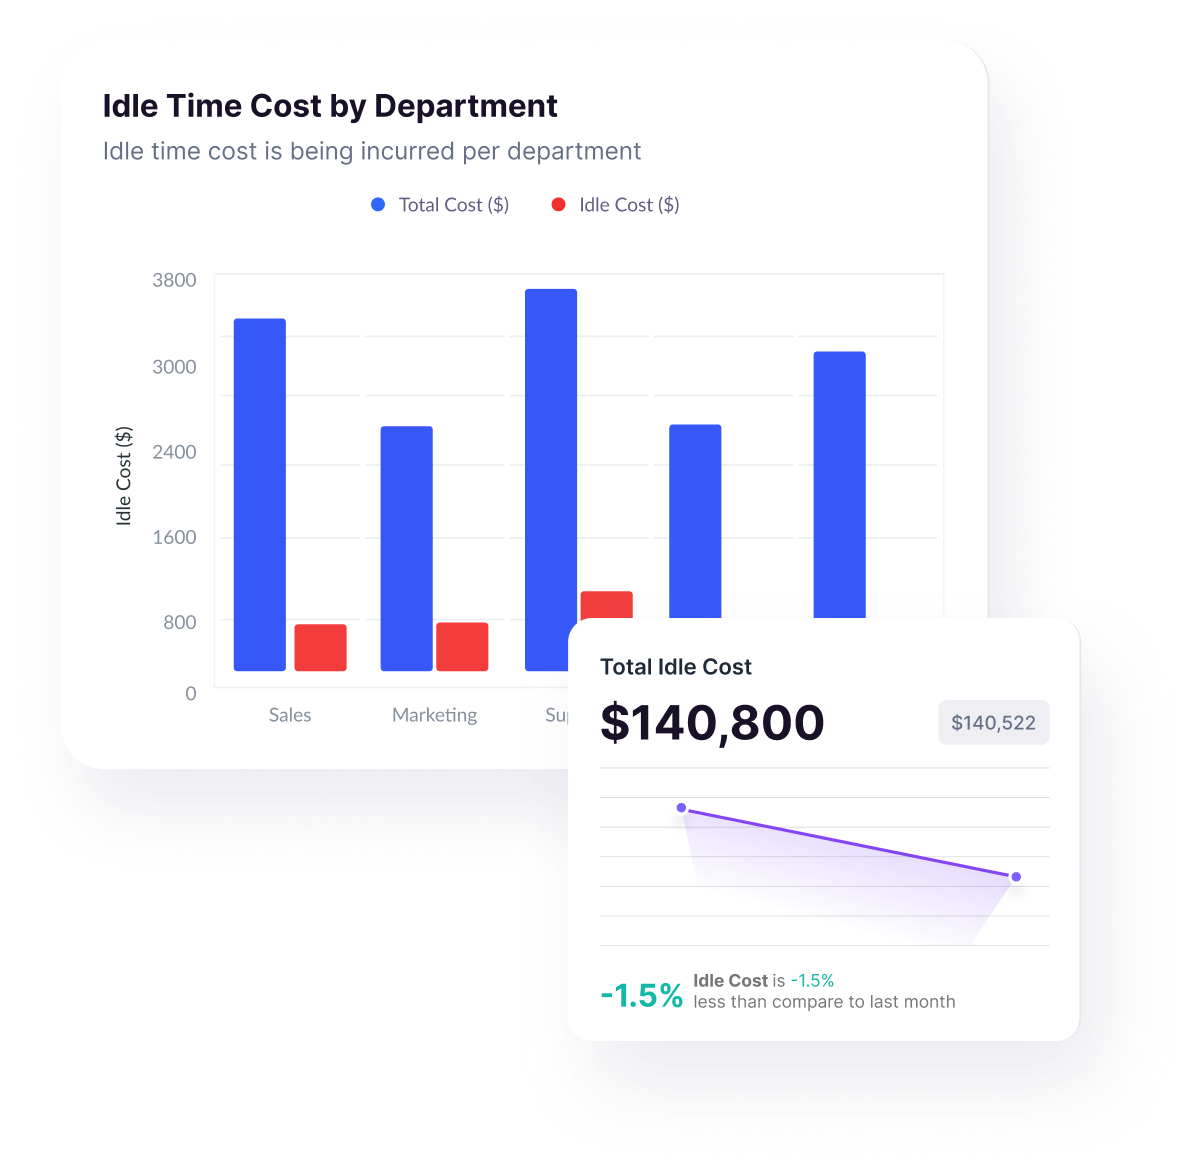
Track how much you're spending on inactivity, by department, tool, and time period.
Idle Cost tracks the financial impact of employees being online but not actively working. It breaks down idle time by department and shows how much each idle hour costs your business. You can also see idle time caused by specific tools like Slack, Teams, or Jira. This helps pinpoint underutilized resources and detect patterns that lead to wasted time. With this data, you can tighten processes, optimize team engagement, and reduce unnecessary salary drain due to inactivity.

Spot hidden cost drains from absenteeism, inefficient workflows, and unproductive tool usage.
Cost Leakage focuses on inefficiencies that often go unnoticed but add up fast. It highlights cost lost to absenteeism, long breaks, online-but-idle hours, and tool underutilization. You’ll see department-wise and category-wise leakage sources, along with trends over time. This feature helps you move beyond surface-level numbers and find where your budget is leaking silently—so you can act on it before it compounds into real financial loss.

Compare cost vs ROI over time and predict future workforce spending with confidence.
This section brings long-term financial intelligence to your workforce planning. You’ll see how your total workforce cost has changed over quarters, how cost aligns with productivity ROI, and how various components like idle cost and tool usage are trending. Forecast graphs compare actual vs predicted spend so you can plan budgets more accurately. It’s a CFO-ready view that turns workforce data into long-term savings and strategic decisions.

No matter what kind of home you have to share, you can increase your earnings.

No matter what kind of home you have to share, you can increase your earnings.

No matter what kind of home you have to share, you can increase your earnings.
Perfect for senior managers, HR leaders, and team heads who want proactive AI-driven insights instead of manual data crunching.


Delivers clear, contextual recommendations—not generic suggestions.
Scans all teams daily for immediate detection of critical issues.
Guidance tailored to each team’s specific trends and risk factors.
Helps reduce churn with early warnings on disengagement.
Ensures privacy and security with encrypted data, secure connections, and multi-standard compliance

Demonstrating our commitment to security, availability, processing integrity, confidentiality, and privacy.

Ensuring compliance with European Union data protection and privacy regulations.

Certified adherence to international standards for information security management.

Demonstrating our commitment to health data privacy, security, and HIPAA compliance.