Productivity

Understand how work gets done—track real productivity beyond just activity.

Simple black outlined square with a small black diamond shape attached at the bottom right corner.

Gain clear insights into how your teams actually work—from time spent on meaningful tasks to patterns in focus and engagement. Go beyond surface-level activity and uncover what truly drives performance across tools, teams, and time.

Productivity Breakdown chart showing 6h 15m productive time, 30m unproductive time, 1h 15m neutral time, and a total of 8h, with a productivity rate of 60% over 14h 30m.
Dashboard showing 9 hours total working time with 8 hours online, 20 minutes offline, and 40 minutes break, peak productivity between 2 PM - 3 PM at 65%, and top category used is Meetings for 14 hours 30 minutes.

See productive hours, tools, and trends in a unified dashboard

See the full picture—without the spreadsheets.

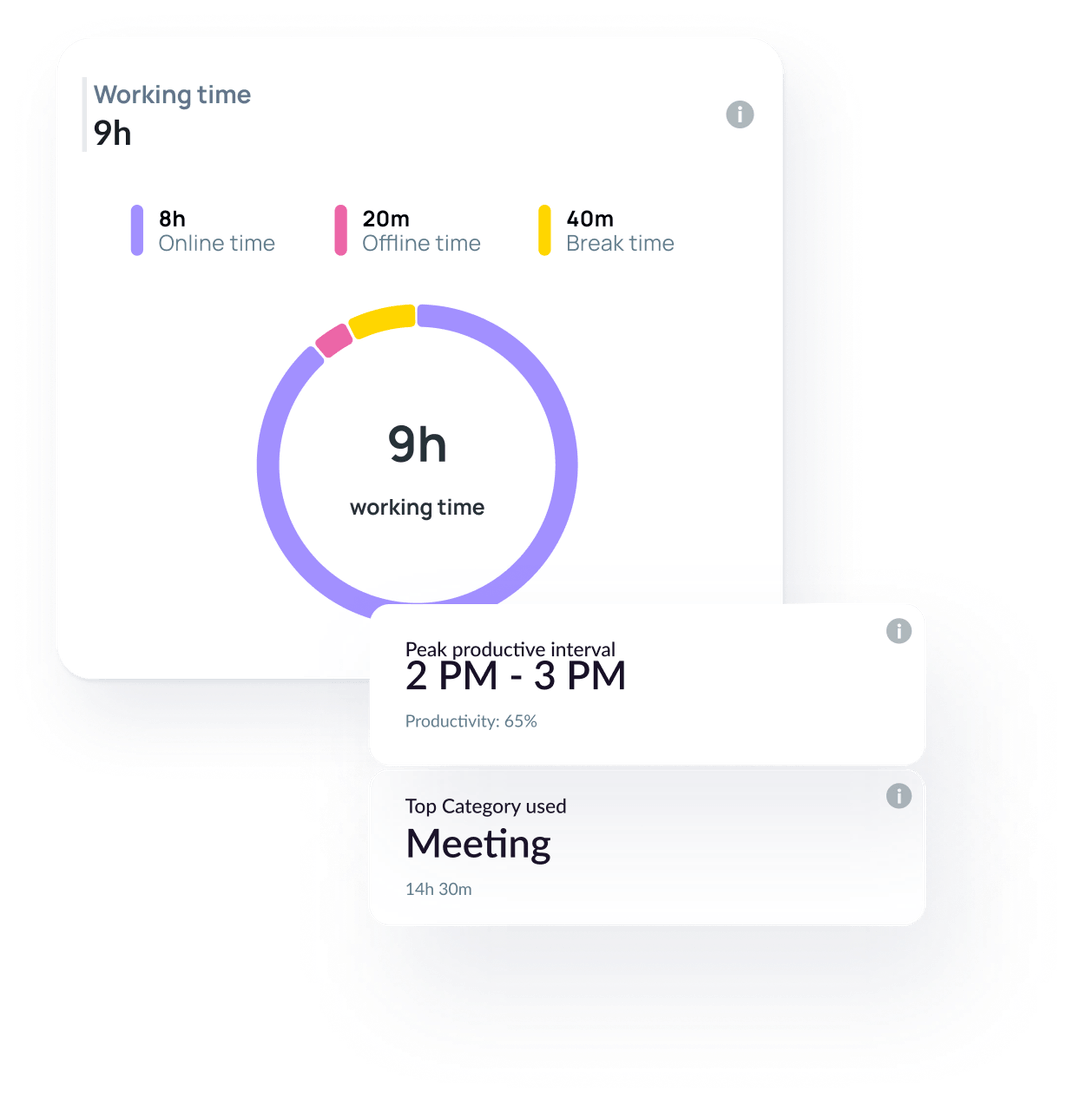
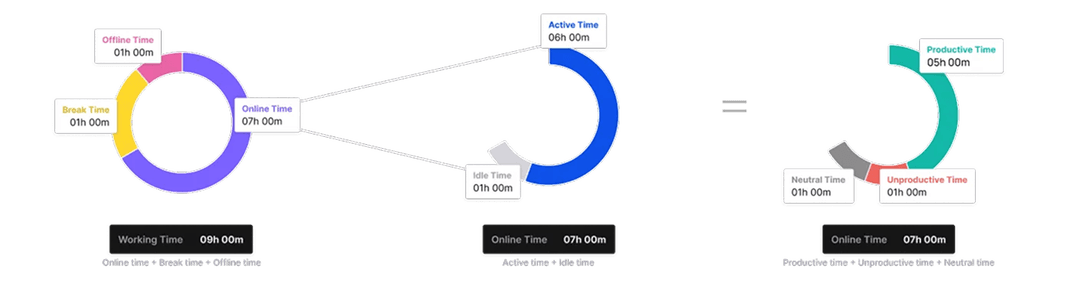
The Overview tab offers a clear summary of where time is being spent productively across your workforce. Identify which tools contribute to focused work, which categories dominate your team’s hours (like collaboration, project management, or CRM), and understand team-level productivity patterns. You’ll see total hours worked, productive hours, neutral time, and distraction-heavy usage—all in one place.

Bar chart titled Teamwise Productivity Trend showing productive, unproductive, and neutral time across teams, with a list highlighting Marketing, Technology, and Design as top productive teams, and HR, Back office, and Sales as least productive teams.

Spot your highest and lowest performers instantly

Find the highs, spot the lows, and act where it matters most.

This tab highlights the top 3 and bottom 3 productive teams or individuals, based on daily or weekly data. Whether it's a star performer maintaining high focus or a team struggling with distractions, you'll get an instant view without number crunching. Use this insight to identify coaching opportunities, improve task alignment, or proactively address burnout risks.

Interface screen welcoming users to ZenAI with selectable questions about employee productivity in a specified team and time period.

Ask questions. Get productivity insights instantly.

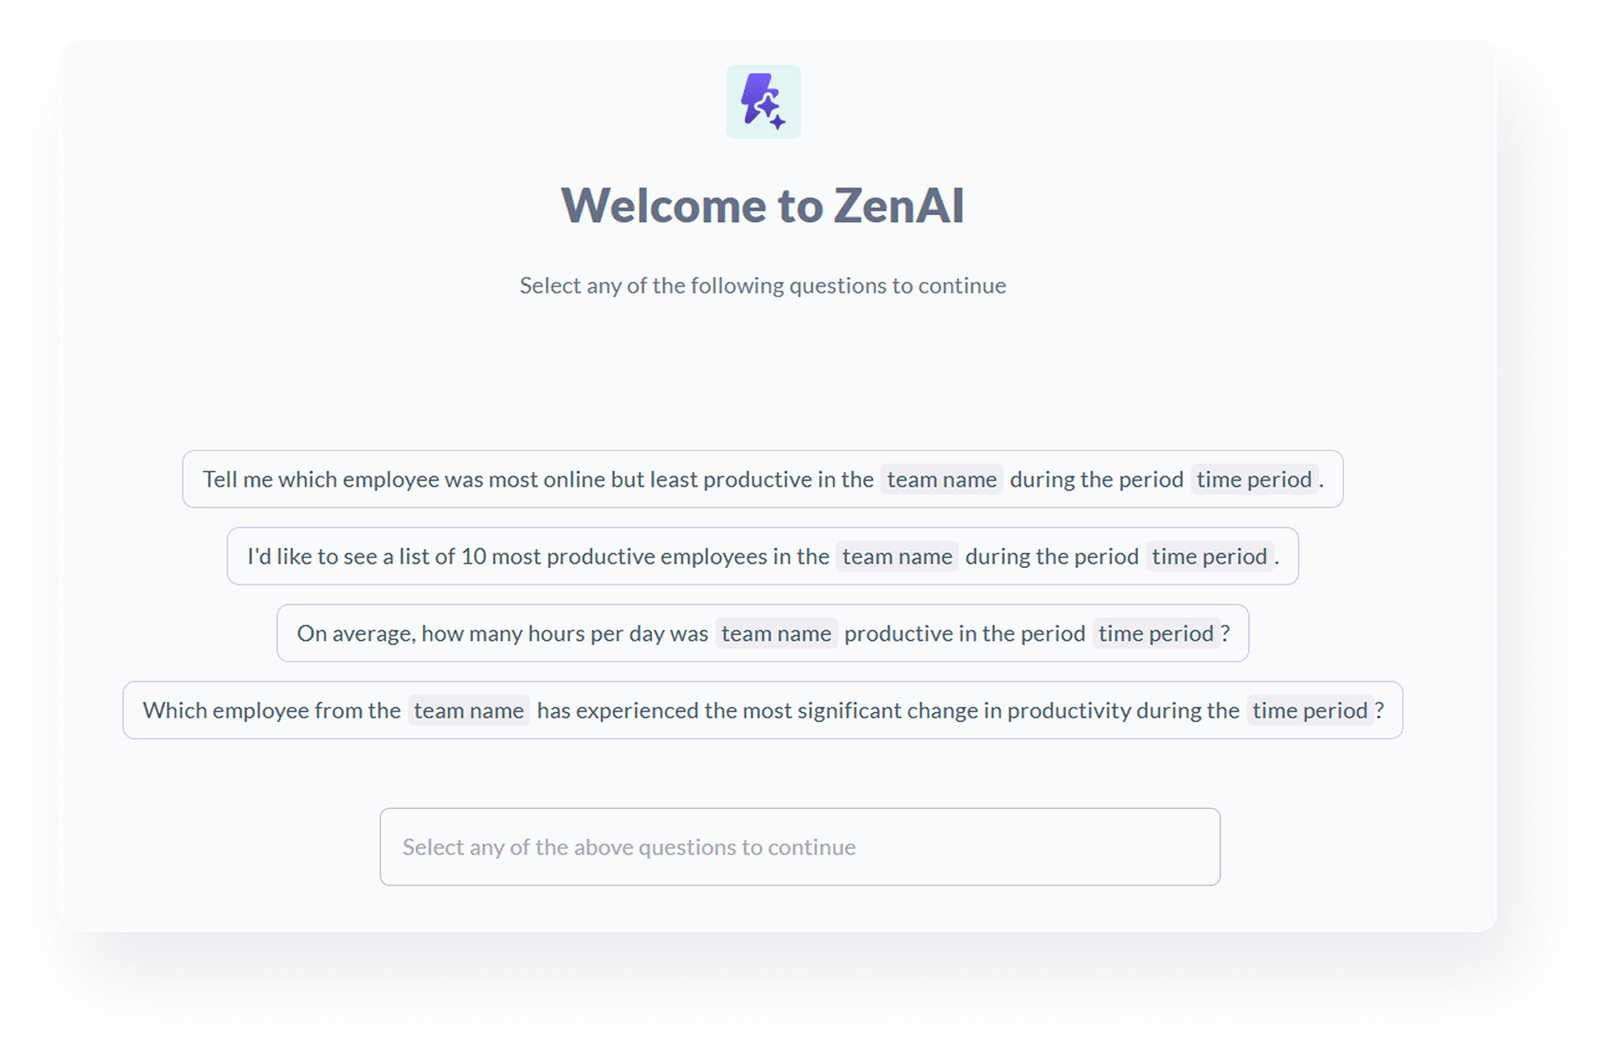
Clarity, without the clicks.

ZenAI acts as your intelligent productivity assistant. Ask in plain English—like “Who had the least productive time this week?” or “Which tool is causing the most distraction?”—and get instant, accurate answers. ZenAI breaks down data barriers, making it easy for managers, HR, or operations to access insights without spreadsheets or dashboards.

Two charts showing work trends: a stacked area chart with Working, Online, Offline, and Break Time from 17/09 to 22/09, and a line chart with Active and Idle Time over the same period.

Track productivity trends over days, weeks, and months.

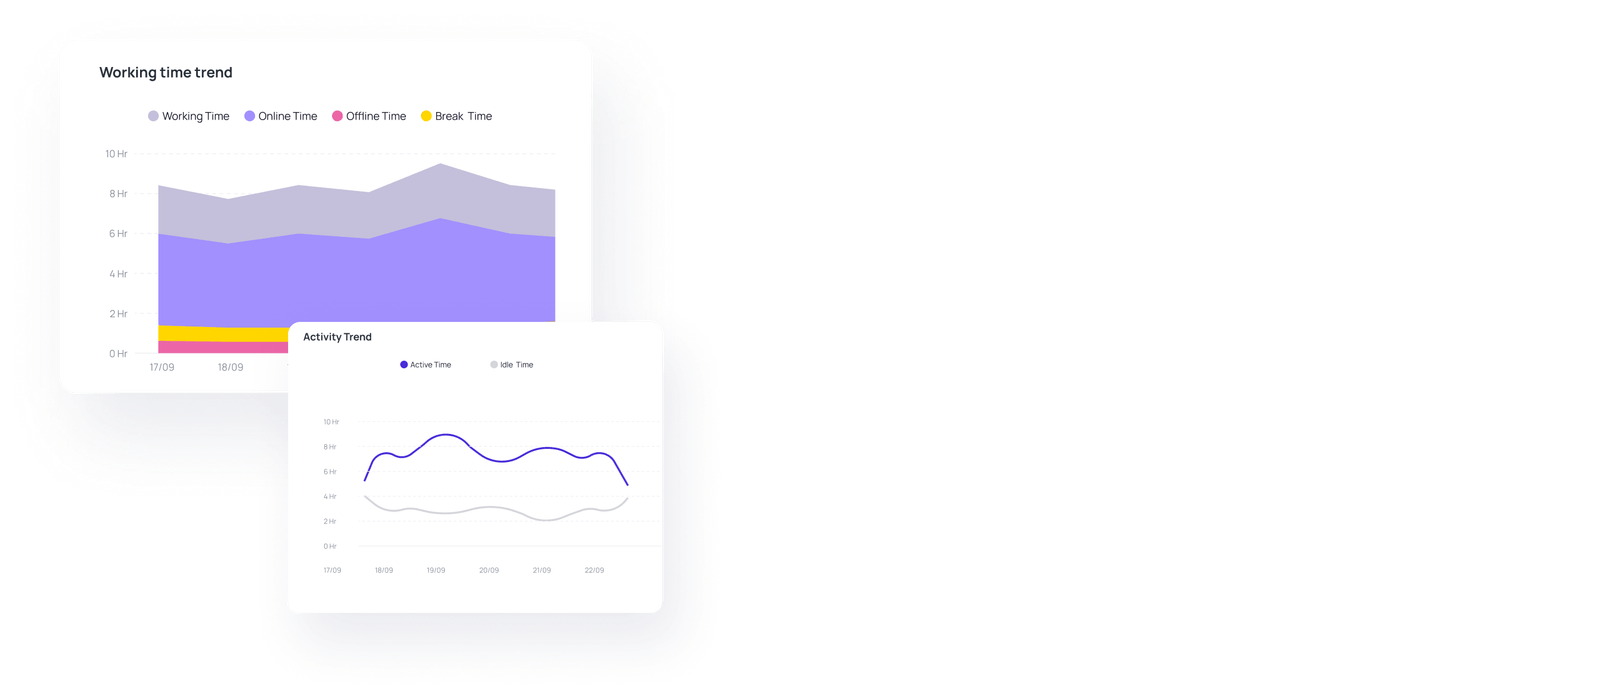
Turn daily data into long-term clarity.

‍Understand how productivity changes over time—at both team and individual levels. Are Mondays more productive than Fridays? Has focus improved since a new tool was introduced? This tab presents visual trends and drill-down analytics that let you trace patterns, measure changes, and respond with timely interventions.

How it works

We're more than an analytic
tool. Explore our features, and
satisfy your customers

Magic wand icon with sparkles inside a light blue circle.

Easy customization

No matter what kind of home you have to share, you can increase your earnings.

Speedometer icon inside a light blue circle.

Secure and fast

No matter what kind of home you have to share, you can increase your earnings.

Shield icon with a checkmark inside, symbolizing security or protection, on a light blue circular background.

Powerful dashboard

No matter what kind of home you have to share, you can increase your earnings.

Three linked ring charts showing time distribution: left donut chart with Offline Time 1h, Break Time 1h, Online Time 7h; middle ring chart splits Online Time into Active Time 6h and Idle Time 1h; right ring chart splits Active Time into Productive Time 5h, Unproductive Time 1h, and Neutral Time 1h.

For
Whom?

Perfect for senior managers, HR leaders, and team heads who want proactive AI-driven insights instead of manual data crunching.

Network illustration showing three connected smiling men inside circles of different sizes on a light background.
Line chart showing attrition trend by region with departments Hilliard, Detroit, and Powell from January to December, highlighting Hyderabad as an underperforming region with productivity at 42%, attendance at 62%, and cost efficiency at 54%.

Feature Benefits Visual Section

Green check mark icon indicating confirmation or success.

Actionable AI

Delivers clear, contextual recommendations—not generic suggestions.

Green check mark icon indicating confirmation or success.

Continuous Monitoring

Scans all teams daily for immediate detection of critical issues.

Green check mark icon indicating confirmation or success.

Personalized Actions

Guidance tailored to each team’s specific trends and risk factors.

Green check mark icon indicating confirmation or success.

Actionable AI

Helps reduce churn with early warnings on disengagement.

Built for Enterprise IT Secure, Compliant, and Scalable

Ensures privacy and security with encrypted data, secure connections, and multi-standard compliance

AICPA SOC2 Type II certification badge with blue circular gradient background.

SOC2 TYPE II

Demonstrating our commitment to security, availability, processing integrity, confidentiality, and privacy.

Blue circular badge with white text reading GDPR Approved and a green check mark below five gold stars.

GDPR

Ensuring compliance with European Union data protection and privacy regulations.

Red and gold ISO 27001 certified badge with stars and laurel wreath design.

ISO

Certified adherence to international standards for information security management.

HIPAA logo featuring the caduceus medical symbol with two snakes entwined around a winged staff on a blue circular background.

HIPAA

Demonstrating our commitment to health data privacy, security, and HIPAA compliance.

Frequently Asked Questions

Who is vsg-365.ai for? What kind of companies benefit most?
My team is already productive. Why would I need vsg-365.ai?
How does vsg-365.ai ensure the security and privacy of our company and employee data?
What about employee privacy?
Where is our data stored?
What are the system requirements for vsg-365.ai?