Agentic AI

AI That Acts. Not Just
Answers

Simple black outlined square with a small black diamond shape attached at the bottom right corner.

Go beyond basic analytics with an AI agent that monitors trends, detects productivity changes, recommends actions, and helps you proactively manage your workforce. Agentic AI translates real-time data into clear, actionable steps to boost team performance.

Bar chart comparing incidents handled by AI versus manual actions across categories: phishing emails, unusual face detection, USB alerts, download/upload, and high bandwidth usage, with AI handling 60% and manual actions 40%.

Instant Action Steps

‍Get clear, tailored recommendations to improve productivity, address issues, and support team growth.

The AI Recommendations tab aggregates all actionable insights across modules. Agentic AI automatically analyzes productivity, activity, attendance, app usage, and more to deliver precise, context-aware guidance. From fixing workflow bottlenecks to reinforcing best practices, each recommendation comes with clear reasoning so managers can act confidently and efficiently—turning data into measurable improvements.

Table showing common security alerts in the last 7 days with alerts like Unusual External Email, Unusual Face Detection, Unusual Downloads, Unusual Uploads, Unusual USB Detection, Phishing Attempt Email, Unauthorized Software Installed, Large Data Download, and Repeated Failed Punch-Ins, including dates, risk scores, and teams involved.

Identify Work Patterns

Pinpoint teams with inconsistent productivity and see detailed breakdowns of daily habits.

This tab provides a team-wise analysis of activity patterns, break averages, productive/unproductive time, and variability risk levels. Agentic AI highlights unusual swings in engagement, helping managers address root causes—like excessive neutral time or uneven work habits—before they impact results. Clear recommendations accompany each insight to guide improvement.

Table showing behavioural insights of Marketing team employees with names, team, and agentic insights; alongside a bar chart comparing Marketing and Sales teams' break, idle, productive, active, and working times in February 2025.

Visualize Team Trends

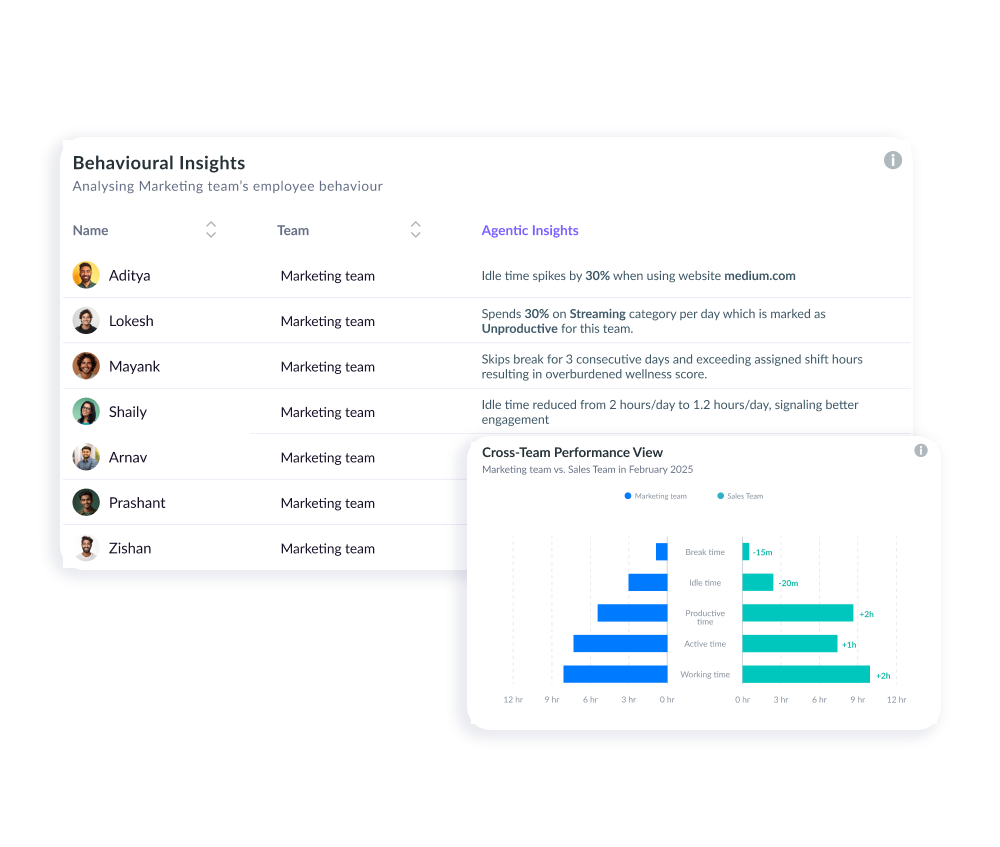
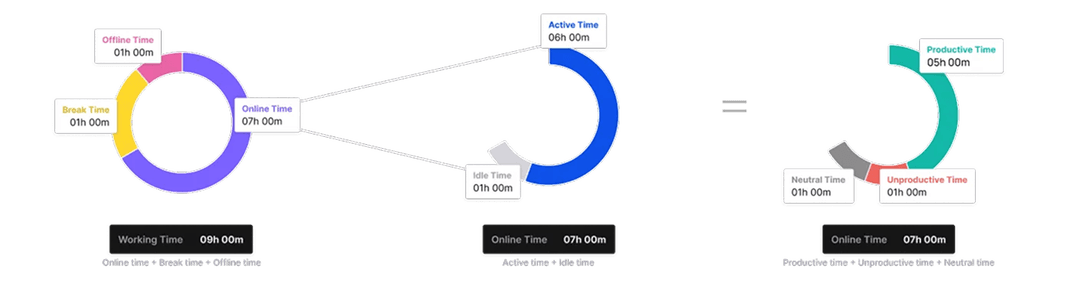
Get graphs showing weekly productivity, working hours, and team size fluctuations.

View long-term patterns for each team through easy-to-read graphs of productivity percentages and working hours across weeks. These insights help you correlate team size, workload, and performance over time, making it simple to identify trends, anticipate issues, and plan capacity more effectively.

Dashboard showing Agentic AI Action bar chart comparing manual and AI actions for phishing emails, face detection, and USB alerts; risk score distribution pie chart with 70% warning-risk, 20% low-risk, 10% critical-risk; and Agentic Recommendations listing productivity peak from 10 am to 12 pm and productivity dip from 1 pm to 3 pm with related task suggestions.

Mitigate Retention Risks

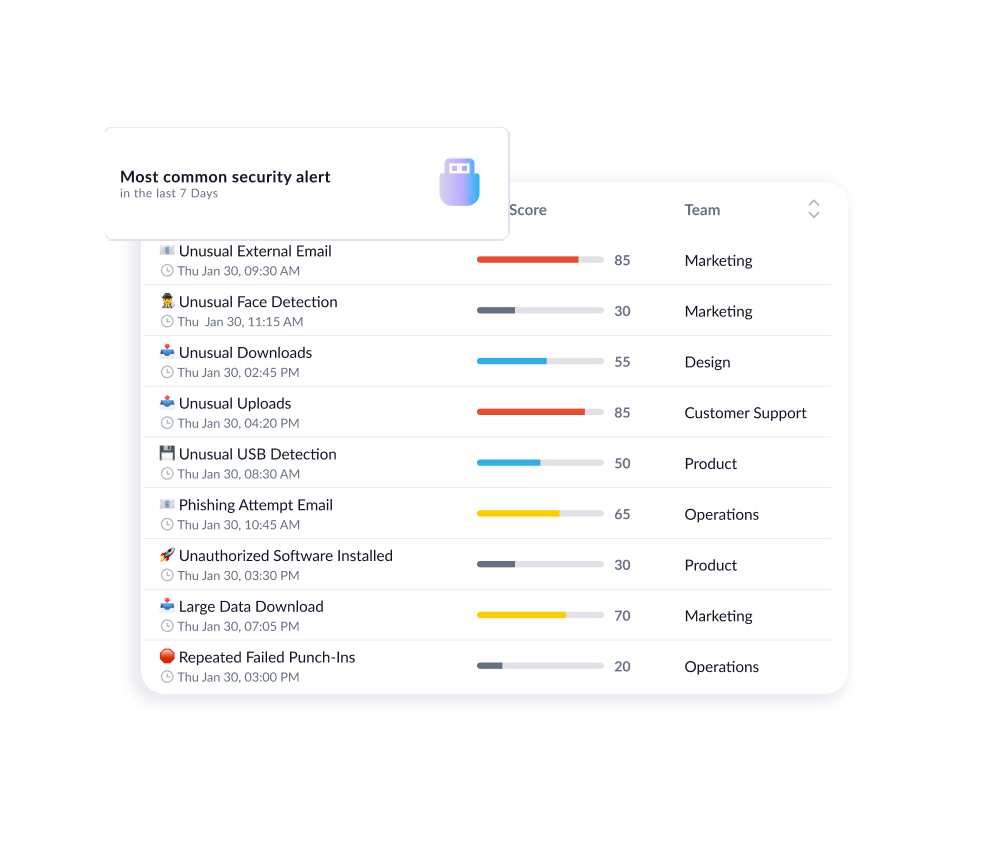
See AI-flagged at-risk teams and employees with detailed risk scores and actionable next steps.

Agentic AI scans attendance, productivity, and engagement metrics to detect employees or teams at risk of churn. It highlights critical cases—like zero attendance or productivity drops—and gives urgent, detailed recommendations (e.g., contact within 4 hours). By identifying risks early, it helps managers act fast to improve retention and protect team stability.

How it works

We're more than an analytic
tool. Explore our features, and
satisfy your customers

Magic wand icon with sparkles inside a light blue circle.

Easy customization

No matter what kind of home you have to share, you can increase your earnings.

Speedometer icon inside a light blue circle.

Secure and fast

No matter what kind of home you have to share, you can increase your earnings.

Shield icon with a checkmark inside, symbolizing security or protection, on a light blue circular background.

Powerful dashboard

No matter what kind of home you have to share, you can increase your earnings.

Three linked ring charts showing time distribution: left donut chart with Offline Time 1h, Break Time 1h, Online Time 7h; middle ring chart splits Online Time into Active Time 6h and Idle Time 1h; right ring chart splits Active Time into Productive Time 5h, Unproductive Time 1h, and Neutral Time 1h.

For
Whom?

Perfect for senior managers, HR leaders, and team heads who want proactive AI-driven insights instead of manual data crunching.

Network illustration showing three connected smiling men inside circles of different sizes on a light background.
Dashboard showing Agentic AI Action bar chart comparing manual and AI actions for phishing emails, face detection, and USB alerts; risk score distribution pie chart with 70% warning-risk, 20% low-risk, 10% critical-risk; and Agentic Recommendations listing productivity peak from 10 am to 12 pm and productivity dip from 1 pm to 3 pm with related task suggestions.

Feature Benefits Visual Section

Green check mark icon indicating confirmation or success.

Actionable AI

Delivers clear, contextual recommendations—not generic suggestions.

Green check mark icon indicating confirmation or success.

Continuous Monitoring

Scans all teams daily for immediate detection of critical issues.

Green check mark icon indicating confirmation or success.

Personalized Actions

Guidance tailored to each team’s specific trends and risk factors.

Green check mark icon indicating confirmation or success.

Actionable AI

Helps reduce churn with early warnings on disengagement.

Built for Enterprise IT Secure, Compliant, and Scalable

Ensures privacy and security with encrypted data, secure connections, and multi-standard compliance

AICPA SOC2 Type II certification badge with blue circular gradient background.

SOC2 TYPE II

Demonstrating our commitment to security, availability, processing integrity, confidentiality, and privacy.

Blue circular badge with white text reading GDPR Approved and a green check mark below five gold stars.

GDPR

Ensuring compliance with European Union data protection and privacy regulations.

Red and gold ISO 27001 certified badge with stars and laurel wreath design.

ISO

Certified adherence to international standards for information security management.

HIPAA logo featuring the caduceus medical symbol with two snakes entwined around a winged staff on a blue circular background.

HIPAA

Demonstrating our commitment to health data privacy, security, and HIPAA compliance.

Frequently Asked Questions

Who is vsg-365.ai for? What kind of companies benefit most?
My team is already productive. Why would I need vsg-365.ai?
How does vsg-365.ai ensure the security and privacy of our company and employee data?
What about employee privacy?
Where is our data stored?
What are the system requirements for vsg-365.ai?